The number you see is the number right now.
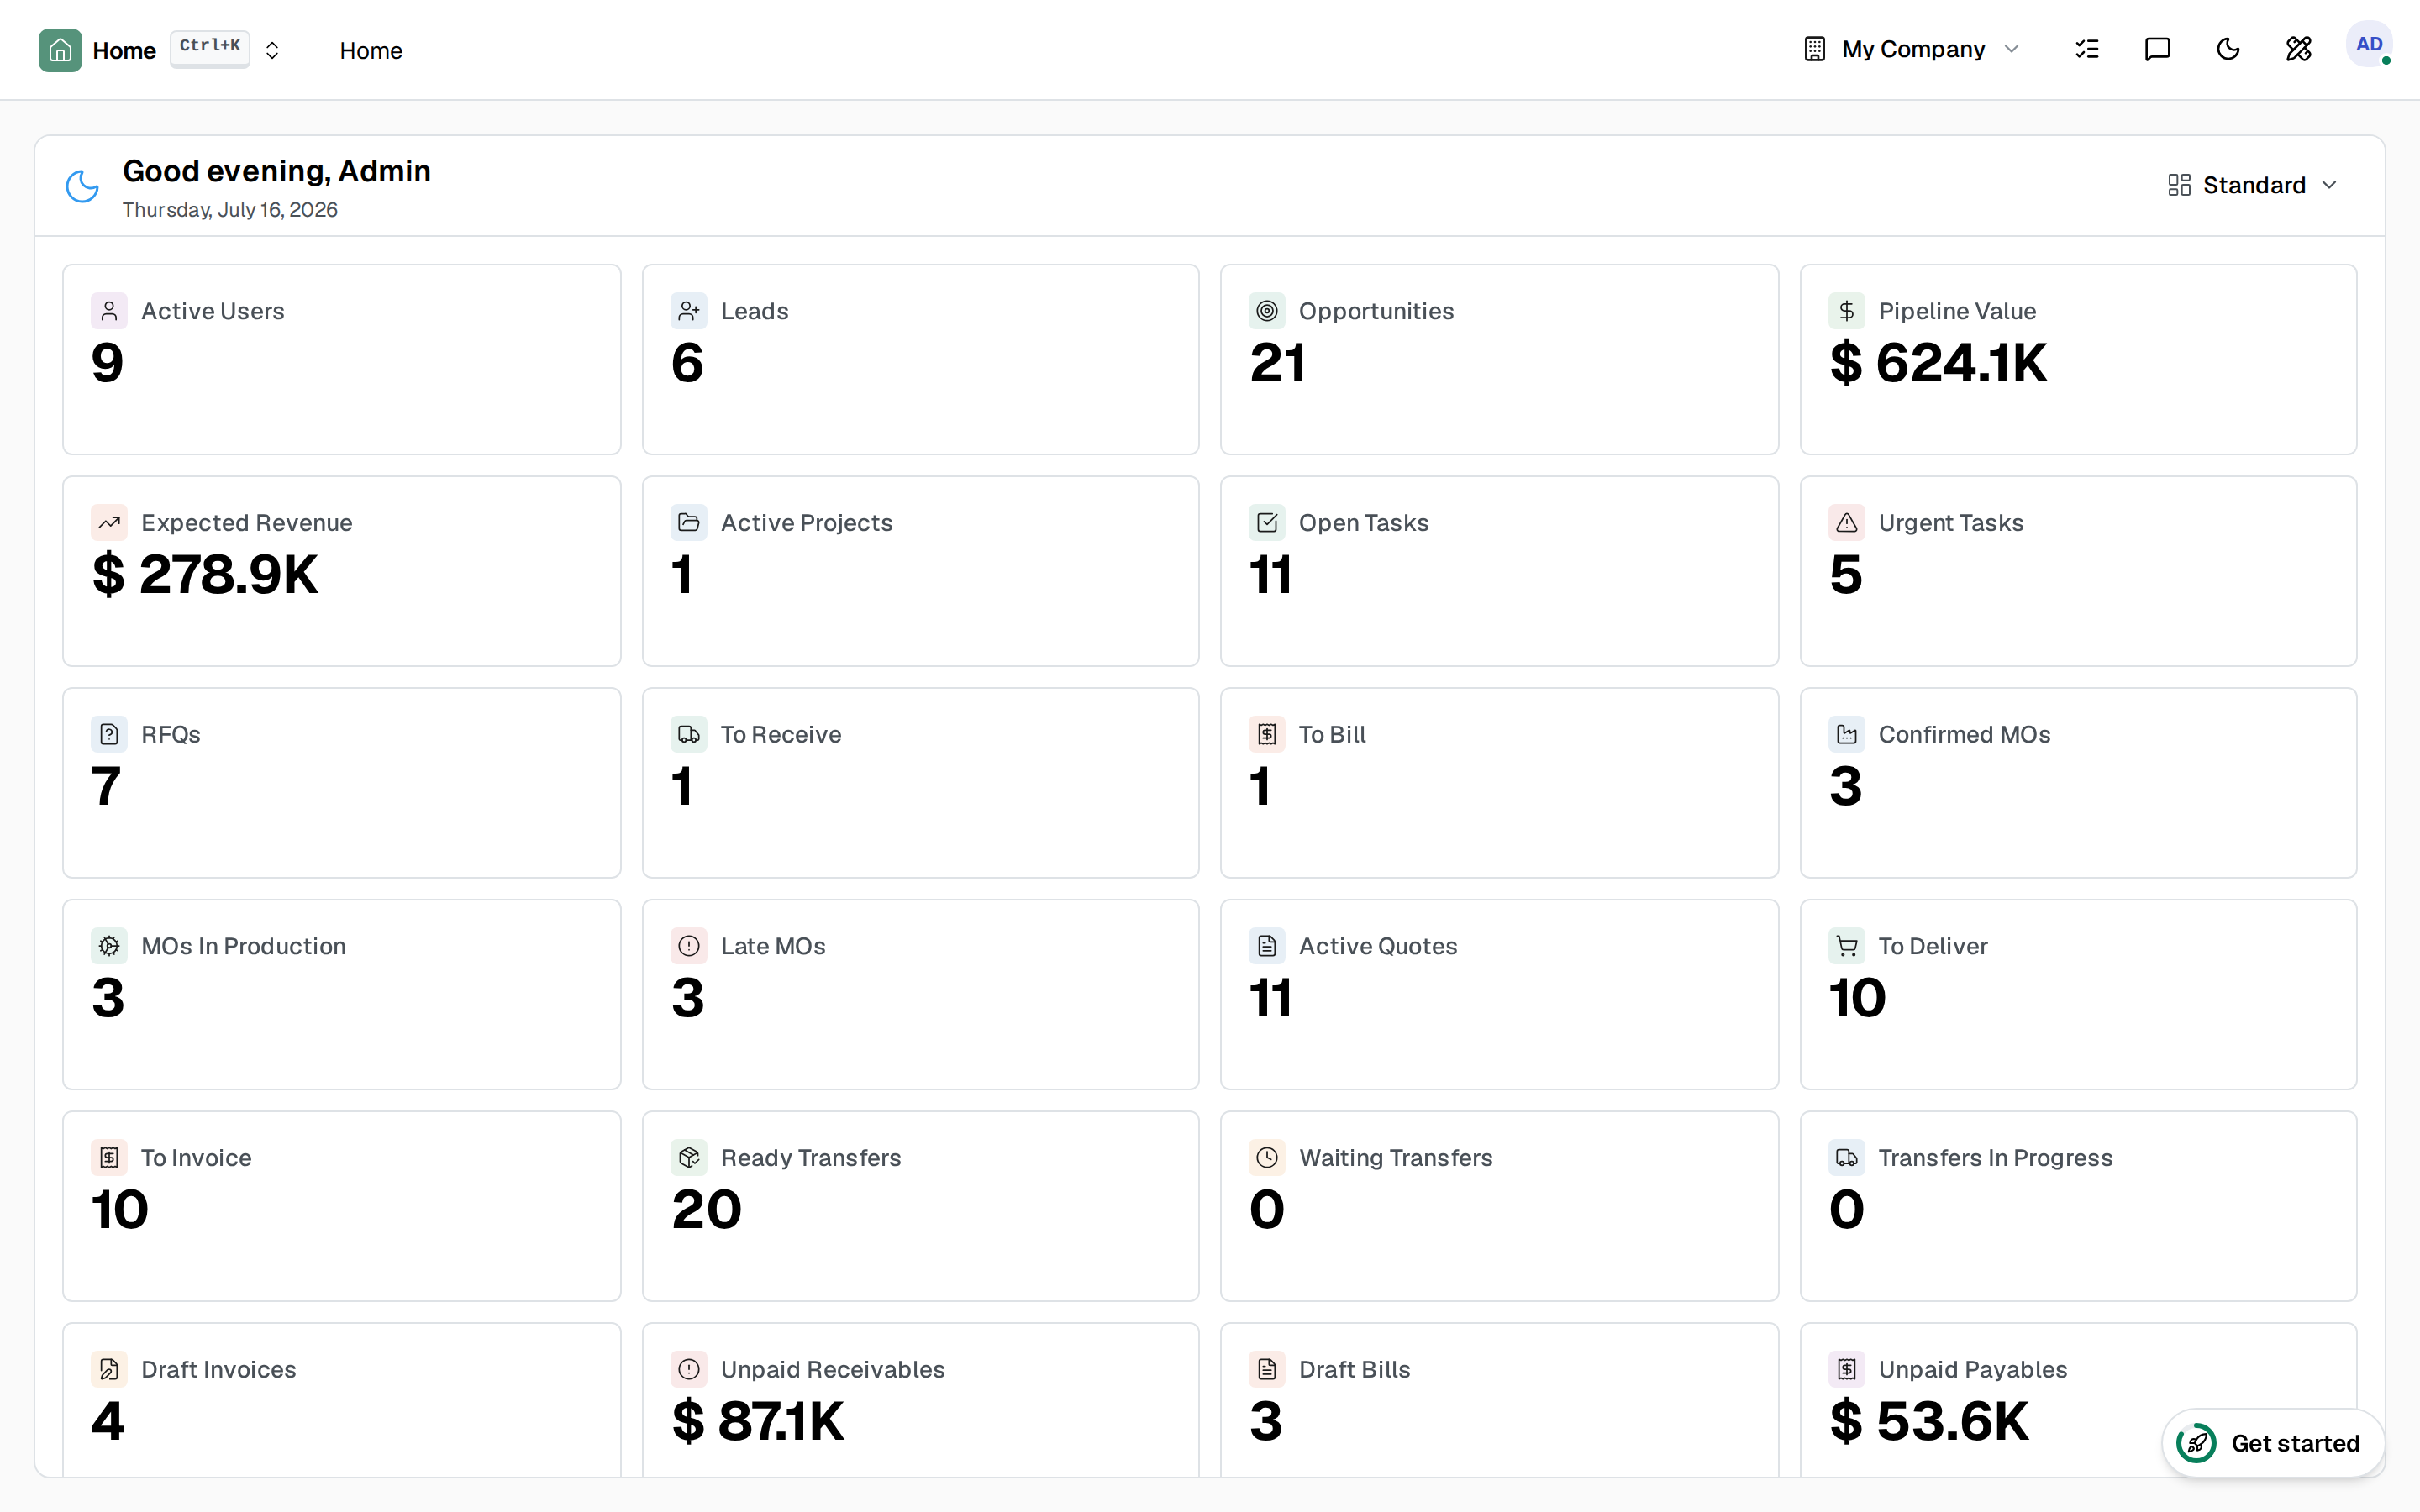
See where the business actually stands right now — pipeline, cash, stock, work orders — with nothing to export, refresh or stitch together first.

Every export is out of date the moment you make it.
You pull the numbers into a spreadsheet, build the chart, and by the meeting it's already wrong. The report becomes a snapshot of the past — and someone has to rebuild it next week.
The board reads what the business is doing.
A widget doesn't point at a copy of your data — it reads the same orders, tasks and invoices your team is working in. Confirm an order, ship a transfer, pay a bill, and the figure on the board has already changed. No refresh, no export, no BI pipeline to keep alive.
Build the view you actually watch.
Drag the widgets that matter to you — a KPI, a bar chart, a list of what's due — into the layout you want, and it's saved to you. Switch between the shared Standard board and your own without touching anyone else's.
Everyone sees what's theirs — and only that.
The shared board's widgets are gated by role, so the same dashboard shows finance its receivables and payables, the floor its open work orders, and sales its pipeline — no clutter, no permission leaks, no separate board to maintain per team.
One connected system
The same customers, products and stock run through Dashboards and every other app — nothing kept in a separate tool.
Open-core
The core apps are open source, and the whole thing is yours to self-host.
Free, unlimited users
Self-host the Free edition with your whole team on it — no per-seat fees, no seat counting, no trial running out.
Only what you need
Run Dashboards on its own, and switch on the rest of the suite when you're ready.
Business dashboards, answered.
Where do the numbers come from?+
Straight from the live data — a KPI reads the same orders, tasks or invoices your team is working in right now. There is no import, no nightly refresh, no export to a BI tool: open the board and the figure is current.
Can I build my own board, or only use a default?+
Both. Everyone gets a shared Standard board, and each person can build and arrange their own — drag the widgets they watch (a KPI, a chart, a list) into the layout they want. Your board is yours.
Does everyone see the same widgets?+
No. Widgets on the shared board are gated by role, so each person only sees the ones meant for them — finance sees receivables and payables, the floor sees open work orders. One board, the right view per person.
Can I chart data from any app?+
Yes — a widget can read any model in the system, so a single board can show sales pipeline, stock to deliver, manufacturing orders and cash owed side by side. Nothing to stitch together.
Can I self-host it?+
Yes — the Free edition runs on your own server, free, with your whole team on it. Prefer not to run servers? We host a managed cloud. Same product either way.
Apps that feed your dashboards
See your whole business at a glance — and run all of it in one place.
Join the waitlist and be first through the door when Fullfinity launches.
Join the waitlist